雅思小作文作为考试中的第一部分,要求考生在20分钟内完成至少150字的学术性写作,主要考察数据描述、趋势分析、信息整合及逻辑组织能力,其题型多样,包括线图、柱状图、饼图、表格、流程图、地图及混合图表等,每种题型需采用不同的写作策略,以下从题型特点、结构框架、语言技巧及注意事项四个维度展开详细解析,并辅以实例说明,最后附相关问答。
题型特点与核心要求
雅思小作文的核心任务是“客观描述+精准对比”,需避免主观评价或个人观点,聚焦数据呈现的规律性信息,不同题型侧重点各异:
- 动态图(线图、柱状图):侧重时间趋势变化(如上升、下降、波动)及不同数据间的对比,需突出关键节点(峰值、谷值、转折点)。
- 静态图(饼图、表格、地图):侧重单一时间点的数据分布或空间差异,需强调比例关系、排序及最值。
- 流程图/地图:侧重步骤逻辑(如生产流程、生命周期)或空间变化(如区域改造),需使用连接词体现顺序或方位。
- 混合图表:需整合两种图表类型(如线图+表格),避免割裂描述,找到数据关联性。
所有题型均需满足“数据准确、逻辑清晰、语言学术”三大原则,且需严格遵循“总-分”结构,确保信息完整覆盖。
通用结构框架
开头段(Introduction):概述图表核心信息
- 目的:用1-2句话说明图表类型、研究对象及时间范围,无需细节数据。
- 公式:图表类型(The chart/table/map shows...)+ 研究对象(the changes in... / the distribution of...)+ 时间/范围(from...to... / in...)。
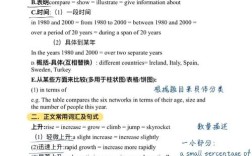
- 示例(线图):“The line graph illustrates the number of international tourists visiting four countries (France, Spain, Italy, and Turkey) from 2010 to 2025.”
主体段(Body):分段描述核心特征
- 分段逻辑:按“主要趋势+次要细节”或“数据分类”划分,通常2-3段,避免信息堆砌。
- 动态图:先整体趋势(如“Overall, the number of... increased steadily”),再分对象/时间段描述(如“France experienced the most significant growth, rising from... to...”)。
- 静态图:按数据大小排序(如“The largest proportion was accounted for by..., at...”),或按类别对比(如“... was higher than..., with a difference of...”)。
- 流程图/地图:按步骤顺序(如“First, raw materials are...”)或空间方位(如“To the north of..., there is...”)描述,强调逻辑衔接。
- 数据选取:选取最典型、最具对比性的数据(如最大值、最小值、倍数关系、异常值),避免罗列所有数据。
结尾段(Conclusion):总结核心规律
- 目的:用1句话重申主要趋势或结论,不引入新数据。
- 公式:Overall, In summary, 或 To conclude + 核心发现(如“Overall, the three countries all showed an upward trend, with... being the most popular”)。
语言表达技巧
数据描述的多样性
- 替换“占”:account for (占比), constitute (构成), make up (占比), represent (代表)。
例:“Agriculture accounted for 30% of the GDP.” → “Agriculture constituted 30% of the GDP.”
- 替换“上升/下降”:动态图中需避免重复使用increase/decrease,可替换为:
- 上升:rise, grow, surge, soar, climb, jump, increase significantly/sharply
- 下降:fall, drop, decline, decrease, slump, dip, reduce gradually
- 波动:fluctuate, vary, oscillate
- 平稳:remain stable/steady, level off, plateau
- 倍数与比较:
- 倍数:“twice as many as...”, “three times higher than...”
- 比较:“..., while/whereas...”, “..., compared with...”
- 差值:“... was higher/lower than... by...”
逻辑连接词的运用
- 顺序:Firstly, Secondly, Finally, Meanwhile, Subsequently
- 对比:In contrast, On the other hand, Whereas, Similarly
- 因果:As a result, Therefore, Consequently
- 举例:For example, Such as
句式变换
- 避免简单句堆砌,可采用复合句或分词结构:
- 简单句:“The number of students increased. It reached 1000 in 2025.”
- 复合句:“The number of students increased, reaching 1000 in 2025.”
- 分词结构:“Increasing steadily, the number of students reached 1000 in 2025.”
各题型注意事项与示例
动态图(以柱状图为例) The chart below shows the percentage of households in different income groups owning a car in a country from 2000 to 2010.
开头段:“The bar chart illustrates the proportion of car ownership among households across three income groups (low, middle, and high) in a country over the decade from 2000 to 2010.”
主体段:
- 总体趋势:“Overall, car ownership increased in all three income groups, with high-income households maintaining the highest rate throughout the period.”
- 分组描述:“Among high-income households, the percentage rose from 80% in 2000 to 95% in 2010, a significant jump of 15 percentage points. In contrast, low-income households saw a more modest increase, from 20% to 35%, while middle-income groups experienced a steady climb from 50% to 70%.”
结尾段:“In summary, the data reveals a clear correlation between income level and car ownership, with all groups showing positive growth, albeit at different rates.”
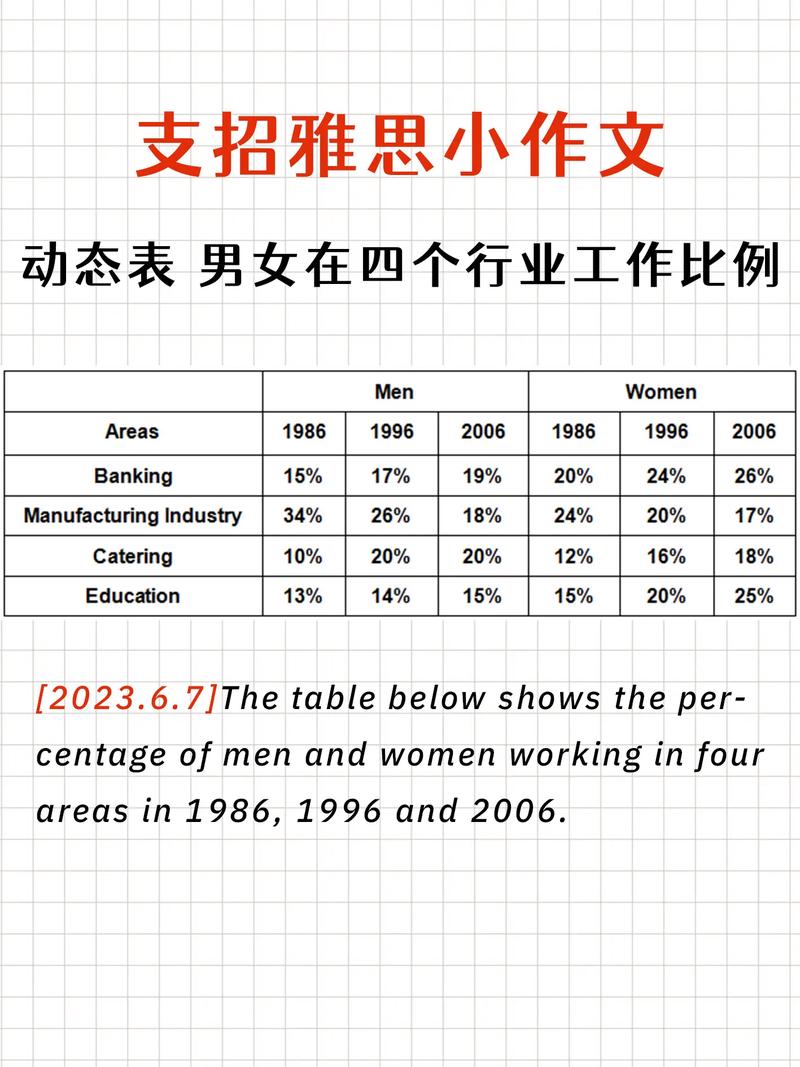
静态图(以表格为例) The table below shows the average monthly expenditure (in dollars) of students in three countries in 2025.
开头段:“The table compares the average monthly spending of students on three categories (rent, food, and entertainment) in the USA, the UK, and Canada in 2025.”
主体段:
- 排序对比:“Students in the USA spent the most overall, with an average of $1200 monthly, primarily due to high rent costs ($800). Canada followed closely at $1100, while the UK had the lowest expenditure at $900.”
- 细节对比:“Rent was the largest expense in all three countries, accounting for two-thirds of total spending in the USA and Canada, and 55% in the UK. Notably, UK students allocated the highest proportion to entertainment ($200), compared to $150 in the USA and Canada.”
结尾段:“Overall, rent dominated students’ budgets across all nations, with the USA showing the highest overall expenditure and the UK the most balanced distribution among categories.”
流程图(以咖啡生产为例) The diagram below shows the process of making coffee.
开头段:“The diagram illustrates the sequential steps involved in producing coffee, from harvesting coffee beans to preparing a final cup of coffee.”
主体段:
- 步骤描述:“Firstly, ripe coffee cherries are picked manually from trees. Subsequently, they are sorted and washed to remove impurities. The cleaned cherries are then dried either in the sun or using machines, a process that reduces their moisture content. Once dried, the outer skin and pulp are removed to extract the green coffee beans, which are then roasted at high temperatures to develop flavor. After roasting, the beans are ground into a powder, finally hot water is poured over the powder to brew the coffee.”
结尾段:“In summary, the coffee production process involves six key stages, from harvesting to brewing, each requiring careful handling to ensure quality.”
常见错误与避坑指南
- 信息遗漏:忽略图表标题、坐标轴标签或单位(如“thousands”“%”),导致描述不准确。
- 主观臆断:添加图表未体现的信息(如“Because of economic growth, the number increased”),需严格基于数据描述。
- 数据罗列:逐一描述所有数据点,未提炼核心趋势(如“2010年100,2011年120,2012年150...”应改为“a steady increase from 100 to 150”)。
- 时态错误:动态图描述过去数据用一般过去时,预测未来用一般将来时;静态图、流程图用一般现在时。
- 词汇重复:频繁使用“show”“increase”等基础词汇,需替换为同义词(如“illustrate”“surge”)。
相关问答FAQs
Q1: 雅思小作文写不到150字怎么办?
A: 若字数不足,通常因数据描述过于简略或缺乏细节分析,可从以下方面补充:① 增加数据对比(如“A的占比为30%,比B高10个百分点”);② 补充倍数关系(如“C的数量是D的两倍”);③ 添加趋势程度(如“缓慢上升”“急剧下降”);④ 优化句式(将简单句合并为复合句或使用分词结构),但需注意避免冗余,确保新增信息有价值。
Q2: 流程图/地图题需要写结论段吗?
A: 需要,结论段的核心功能是总结核心规律,流程图可总结步骤的总体特征(如“整个过程包含X个主要阶段,从...到...”),地图可总结主要变化(如“该区域从以农业为主转变为以商业为主”),结论段无需重复细节,1句话即可,但不可或缺,否则结构不完整。