雅思小作文作为考试中的第一部分,其重要性不言而喻,它要求考生在20分钟内完成至少150字的写作任务,主要考察数据描述、信息概括和逻辑组织能力,许多考生在备考过程中常常感到困惑,不知如何下笔,或写出的内容缺乏条理、语言单一,掌握核心句型和表达方式是提升雅思小作文分数的关键,本文将通过详细解析不同图表类型的核心例句,帮助考生构建清晰的写作框架,丰富语言表达,从而在考试中取得理想成绩。
雅思小作文主要分为静态图(如柱状图、线形图、饼图、表格图)和动态图(如线形图、柱状图),此外还有流程图和地图题,无论面对何种图表,文章结构通常分为三段:引言(Introduction)、主体段(Body Paragraphs)和结论(Conclusion),引言部分需要改写题目,说明图表所展示的核心信息;主体段则需根据图表特点分段描述关键数据和趋势;结论段总结主要特征或变化,无需添加新信息,以下将针对不同图表类型,提供实用的例句和写作思路。
对于静态图表,核心在于“比较”和“对比”,在描述柱状图时,考生需要找出最高值、最低值以及数据间的差异,假设某柱状图展示了2025年五个国家的可再生能源占比,最高值为瑞典的45%,最低值为日本的15%,中间值为德国的30%、法国的25%和中国的20%,引言部分可以写:“The bar chart illustrates the proportion of renewable energy in the total energy consumption of five countries in 2025.” 主体段可以这样展开:“As can be seen from the chart, Sweden ranked first with 45%, significantly higher than Japan, which had the lowest proportion at 15%. Germany and France stood at 30% and 25% respectively, while China’s figure was 20%, placing it in the middle range.” 这里,“ranked first with...”“significantly higher than...”“stood at...”等表达方式清晰地展示了数据间的对比关系,如果涉及多个数据的比较,还可以使用“while”“whereas”“in comparison with”等连接词,“Germany accounted for 30%, whereas France’s share was 5% lower.”
饼图通常用于展示整体中的比例关系,描述时需注意“占比”和“构成”,假设一个饼图展示了2025年全球塑料垃圾的回收比例:回收利用占20%,焚烧发电占30%,填埋处理占45%,其他处理方式占5%,引言可写:“The pie chart presents the distribution of global plastic waste disposal methods in 2025.” 主体段可以这样描述:“The majority of plastic waste, 45%, was sent to landfill sites, followed by incineration for energy generation, which accounted for 30%. Recycling constituted only 20% of the total, with the remaining 5% being other disposal methods.” 这里的“the majority of...”“followed by...”“constituted only...”等句式有效突出了主要和次要部分,若饼图包含两个或以上时间点的数据,则需注意静态与动态的区别,即使是静态比较,也应明确时间点,“In 2025, the proportion of A was 40%, while in 2025, it decreased to 30%.”
表格图的描述关键在于“分类”和“具体数据”,假设一个表格比较了2025年和2025年三个城市的人口数量和人均GDP:城市A人口从500万增至550万,人均GDP从5万美元增至6万美元;城市B人口稳定在600万,人均GDP从4万美元增至4.5万美元;城市C人口从400万降至350万,人均GDP从3万美元增至3.5万美元,引言可写:“The table compares the population and per capita GDP of three cities in 2025 and 2025.” 主体段可分城市描述:“City A experienced a population growth from 5 million to 5.5 million, accompanied by an increase in per capita GDP from $50,000 to $60,000. In contrast, City B’s population remained stable at 6 million, but its per capita GDP rose from $40,000 to $45,000. City C, however, saw a decline in population from 4 million to 3.5 million, though its per capita GDP still grew to $35,000.” 这里,“experienced a growth from...to...”“remained stable at...”“saw a decline from...to...”等表达准确概括了变化趋势,而“accompanied by”“in contrast”“however”等连接词增强了逻辑性。
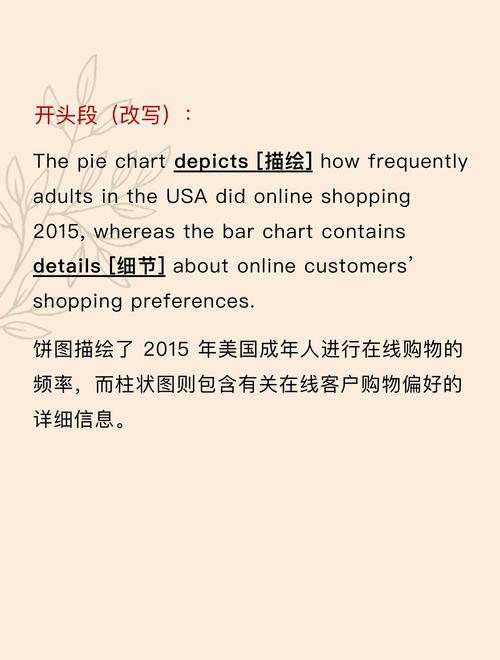
动态图表的核心在于“变化趋势”的描述,包括上升、下降、波动和稳定等,假设一条线形图展示了2010-2025年某国线上购物用户数量的变化:从2010年的10%增至2025年的60%,中间在2025-2025年增速放缓,2025年后加速增长,引言可写:“The line graph depicts the changes in the percentage of online shopping users in a country from 2010 to 2025.” 主体段可分阶段描述:“Overall, the percentage showed a significant upward trend throughout the period. Starting at 10% in 2010, it gradually increased to 35% by 2025. The growth rate slowed down between 2025 and 2025, with the figure rising slightly to 40%. However, after 2025, there was a rapid surge, and the percentage reached 60% in 2025.” 这里的“showed a significant upward trend”“gradually increased to...”“slowed down”“rose slightly to...”“rapid surge”等词汇精准描述了不同阶段的变化特征,描述动态数据时,常用“increase by”(增加了多少)、“increase to”(增加到多少)、“decrease by”“decrease to”等短语,“The number of users increased by 20% from 2010 to 2025.”
流程图和地图题在雅思小作文中占比较小,但同样需要清晰的逻辑顺序,流程图描述某个过程或操作步骤,常用“Firstly, Secondly, Finally”或“The first step is...”“Following this, ...”“Finally, ...”等连接词,描述咖啡制作过程:“Firstly, coffee beans are picked and then roasted. After that, they are ground into powder. Next, hot water is poured over the powder, and finally, the coffee is ready to be served.” 地图题则需注意方位词(north, south, east, west)和位置关系(next to, opposite, between),“In 2000, there was a park in the north of the town, with a library next to it. By 2025, the park had been replaced by a shopping center, and the library was moved to the south of the town.”
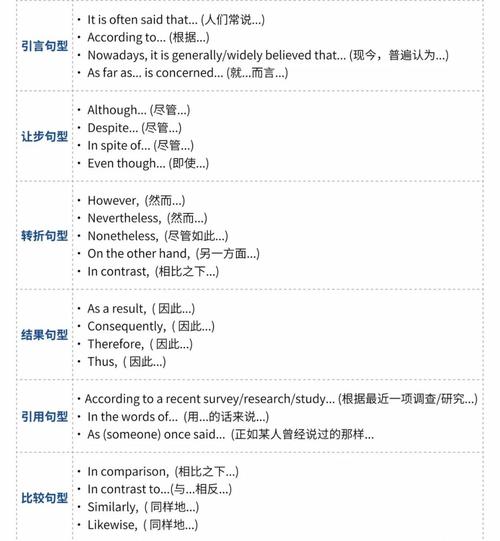
在语言表达方面,考生应避免重复使用简单词汇和句型,例如表示“增加”时,除了“increase”,还可以使用“rise, grow, surge, climb, escalate”等;表示“减少”时,可用“decrease, decline, drop, fall, diminish”等,要注意数据的准确性,描述趋势时需结合具体数据,避免泛泛而谈,与其写“The number increased.”,不如写“The number increased from 20 to 30.” 合理使用被动语态可以使描述更客观,The data was collected in 2025.”而非“We collected the data in 2025.”
雅思小作文的备考需要考生熟悉不同图表类型的结构和核心句型,通过大量练习掌握数据描述和逻辑组织的方法,在写作过程中,务必注意文章结构的清晰性、语言的多样性和数据的准确性,这样才能在有限的时间内完成一篇高质量的作文。

FAQs
-
问:雅思小作文中,是否需要总结所有数据?
答:不需要,雅思小作文的结论段只需总结图表最显著的特征或整体趋势,无需重复所有数据,若柱状图显示三个国家的数据分别为40%、30%、20%,结论可写:“Country A had the highest proportion, while Country C had the lowest.” 避免在结论中引入新的数据或细节。 -
问:动态图表中,如果数据波动较大,如何描述趋势?
答:对于波动较大的数据,可分阶段描述,使用“fluctuated”“peaked at”“reached a low point”等词汇。“The figure fluctuated between 10% and 30% from 2010 to 2025, peaking at 30% in 2012 and dropping to a low of 10% in 2025.” 这样既准确又体现了数据的动态变化。