雅思小作文的开头是整篇文章的“门面”,其质量直接影响考官对第一印象的形成,在雅思写作评分标准中,“任务回应”(Task Response)和“连贯与衔接”(Coherence and Cohesion)是核心评分项,而开头段恰恰是这两项的直接体现——它需要清晰点明图表核心信息,并通过逻辑结构为下文铺垫,掌握开头段的写作方法,是雅思小作文取得高分的关键前提。
开头段的核心功能与写作原则
雅思小作文的开头段并非简单重复图表信息,而是需要承担三大核心功能:点明图表类型、概括核心趋势/特征、引出下文具体分析,基于此,写作时需遵循以下原则:
- 准确性:确保图表类型(如线图、柱状图、饼图、表格、流程图、地图)描述无误,核心数据(如最高值、最低值、整体趋势)概括准确,避免曲解图表信息。
- 简洁性:开头段篇幅建议控制在2-3句话,约40-60词,避免冗长细节(如具体数据、波动过程),这些内容应留到主体段展开。
- 客观性:仅呈现图表中客观存在的信息,不添加个人观点或推测(如“我认为未来数据会继续上升”),也不使用过于绝对的词汇(如“only”“always”)。
不同图表类型的开头段写法
雅思小作文图表可分为“数据类”(线图、柱状图、饼图、表格)和“流程/地图类”两大类,不同类型的图表在开头段的信息侧重点和表达方式上存在差异。
(一)数据类图表(线图、柱状图、饼图、表格)
数据类图表的核心是“数据对比”或“数据分布”,开头段需明确图表反映的时间范围、对象及整体趋势/最显著特征,以下是通用结构:
“The chart/graph/table illustrates/provides information about [图表主题] in [时间范围/地点].”
“Overall, [概括核心趋势/最显著特征, 如最高/最低值、主要变化方向、主体构成等].”
线图(Line Graph)
线图的核心是“变化趋势”,开头段需点明时间跨度和整体动态(上升/下降/波动)。
- 示例(剑15 Test1):
“The line graph illustrates the number of overseas visitors to three different countries (Australia, France, and Malaysia) from 1995 to 2005. Overall, the number of visitors to Australia and France showed an upward trend over the decade, while Malaysia experienced a fluctuation with a slight increase by 2005.”
(解析:第一句点明图表类型“line graph”、主题“overseas visitors to three countries”、时间范围“1995 to 2005”;第二句概括整体趋势——澳大利亚和法国上升,马来西亚波动后小幅增长。)
柱状图(Bar Chart)
柱状图的核心是“数据对比”,开头段需点明对比对象和时间范围,并概括最高/最低值或主要差异。
- 示例(剑16 Test2):
“The bar chart compares the proportion of energy produced from different renewable sources (solar, wind, hydro, and biomass) in four countries (Germany, Italy, Spain, and Denmark) in 2025. Overall, Denmark relied most heavily on wind energy, accounting for over 40% of its renewable energy production, while Germany’s energy mix was more diversified, with solar power being the largest contributor.”
(解析:第一句点明图表类型“bar chart”、对比对象“energy produced from different renewable sources in four countries”、时间“2025”;第二句概括核心差异——丹麦依赖风能,德国能源结构更多元,太阳能占比最高。)
饼图(Pie Chart)
饼图的核心是“比例构成”,开头段需点明整体对象和主要组成部分(最大/最小占比)。
- 示例(某真题):
“The pie charts show the distribution of household expenditure in a country in 1950 and 2010. Overall, in 1950, the largest proportion of spending was on food (35%), while by 2010, this had decreased significantly to 15%, with housing becoming the largest expense at 40%.”
(解析:第一句点明图表类型“pie charts”、主题“distribution of household expenditure”、时间对比“1950 and 2010”;第二句概括核心变化——食品占比下降,住房占比上升并成为最大支出。)
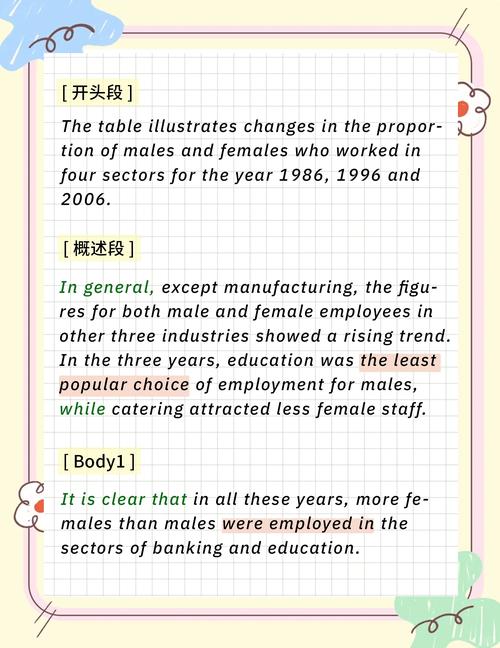
表格(Table)
表格的核心是“多维度数据对比”,开头段需点明对比对象和时间范围,并概括最突出的数据差异或趋势。
- 示例(剑14 Test3):
“The table presents data on the percentage of students who participated in three types of sports (football, basketball, and swimming) in a high school in 2025 and 2025. Overall, football was the most popular sport in both years, with participation rates of 45% in 2025 and 50% in 2025, while swimming saw the smallest number of participants, decreasing from 20% to 15% over the five-year period.”
(解析:第一句点明图表类型“table”、主题“percentage of students participating in three types of sports”、时间“2025 and 2025”;第二句概括核心对比——足球最受欢迎且占比上升,游泳参与率最低且下降。)
(二)流程图(Process Diagram)与地图(Map)
流程图和地图属于“非数据类”图表,核心是“步骤顺序”或“空间变化”,开头段需点明描述的对象和整体流程/变化方向。
流程图(Process Diagram)
流程图需点明“制作/发展过程”的起点和终点,以及主要阶段。
- 示例(某真题:巧克力制作过程):
“The diagram illustrates the process of how chocolate is produced from cocoa beans. Overall, the process consists of several stages, starting with the harvesting of cocoa beans, followed by their fermentation, drying, and roasting, before they are ground into chocolate liquor and finally processed into different chocolate products.”
(解析:第一句点明图表类型“diagram”、主题“process of how chocolate is produced from cocoa beans”;第二句概括流程阶段——从收获豆子到发酵、干燥、烘焙,研磨成巧克力浆,最后制成产品。)
地图(Map)
地图需点明“区域变化”的时间对比和主要改造方向(如新增设施、功能转变)。
- 示例(剑17 Test4):某小镇1990年与2025年地图变化):
“The maps show the changes that have taken place in a small town between 1990 and 2025. Overall, the town has undergone significant development, with the construction of a new road, a shopping center, and several housing estates, while the farmland and forest to the east have been largely replaced by urban infrastructure.”
(解析:第一句点明图表类型“maps”、主题“changes in a small town between 1990 and 2025”;第二句概括核心变化——新建道路、购物中心和住宅区,东部农田和森林被城市设施取代。)
开头段常见错误与避坑指南
-
遗漏关键信息:未点明图表类型、时间范围或核心主题,导致任务回应不完整。
- 错误示例:“The number of visitors increased.”(未说明图表类型、时间、对象)
- 修改:“The line graph shows the number of overseas visitors to Australia from 1995 to 2005, which increased overall.”
-
过度细节化:在开头段罗列具体数据(如“in 1995, the number was 10000, and in 2000, it rose to 15000”),导致冗长且缺乏概括性。
- 错误示例:“The bar chart shows that in 2025, 30% of people used cars, 25% used buses, and 20% used bikes.”(数据过多,应留到主体段)
- 修改:“The bar chart compares the percentage of people using different transport modes (cars, buses, bikes) in 2025. Overall, cars were the most commonly used transport.”
-
主观臆断:添加图表未体现的信息或个人观点。
- 错误示例:“The number of students will continue to increase in the future.”(图表未涉及未来预测)
- 修改:“The number of students increased significantly between 2010 and 2025.”
-
语法与词汇错误:时态混乱(如线图用一般现在时而非过去时)、搭配不当(如“describe a chart”应为“illustrate a chart”)。
- 错误示例:“The graph describes the population growth in China.”(“describe”搭配不当)
- 修改:“The graph illustrates the population growth in China.”
开头段高分表达模板
为提升语言准确性,可积累以下高频表达:
| 功能 | 表达句式 |
|---|---|
| 点明图表类型 | The line graph/bar chart/pie chart/table illustrates/provides data on/shows... |
| 点明时间范围 | in [年份]/between [年份A] and [年份B]/from [年份] to [年份] |
| 概括整体趋势(线图) | Overall, [对象] showed an upward/ downward/ fluctuating trend. |
| 概括对比差异(柱状图) | Overall, [对象A] was the highest/lowest, while [对象B] ranked second. |
| 概括比例构成(饼图) | Overall, [组成部分] accounted for the largest proportion (XX%), followed by... |
| 概括流程阶段(流程图) | Overall, the process consists of [X] stages, starting with... and ending with... |
| 概括空间变化(地图) | Overall, [区域] witnessed significant changes, with the addition of... and the removal of... |
开头段写作步骤总结
- 审题定位:快速识别图表类型(线图/柱状图/饼图/表格/流程图/地图)、主题(如“energy consumption”“population growth”)和时间范围(“in 2025”“between 2010 and 2025”)。
- 首句定调:用“图表类型+主题+时间范围”的结构写出第一句,确保信息完整。
- 次句概括:根据图表类型,用“Overall”引出核心趋势/特征(线图:趋势;柱状图:对比;饼图:比例;流程图:阶段;地图:变化)。
- 检查优化:核对语法、时态(数据类图表若描述过去时间用过去时,地图/流程图用一般现在时)、词汇准确性,避免细节堆砌。
FAQs
Q1: 雅思小作文开头段是否必须使用“Overall”一词?
A1: 不强制使用,但“Overall”是概括核心信息的标志性词汇,能有效体现“连贯与衔接”评分项中的“分段与逻辑”,若不用“Overall”,也可通过“Generally speaking”“In summary”等短语替换,或直接用第二句概括核心信息(如第一句描述图表,第二句用“This indicates that...”引出趋势),但需注意,避免在开头段使用过多衔接词,以免显得冗余。
Q2: 如果图表包含多个对象或时间点,开头段是否需要全部提及?
A2: 不需要全部详细提及,但需涵盖“整体范围”,柱状图对比4个国家3种能源,开头段可概括为“the bar chart compares the proportion of three renewable energy sources in four countries in 2025”,无需列出所有国家名称;若图表包含2个时间点(如1990和2025),需点明时间对比(“between 1990 and 2025”),但具体变化趋势需概括性描述(如“the number increased significantly”),而非分时间点罗列数据。