雅思小作文中的条形图(Bar Chart)是数据类作文中常见的题型之一,主要考察考生对数据的描述、比较和分析能力,这类题目通常提供一组或多组数据,要求考生通过文字清晰呈现数据特征、变化趋势及不同数据间的关联,以下将从条形图的分类、结构拆解、核心技巧、常用表达及范文解析等方面展开详细说明,帮助考生系统掌握此类题型的写作方法。
条形图的分类与特点
条形图根据数据呈现方式可分为单组条形图、多组条形图、堆叠条形图和分段条形图四种类型,每种类型的数据逻辑和写作重点略有不同:
- 单组条形图:仅展示一个类别的数据,如“某国2025年可再生能源占比”,重点在于描述数据大小及排序。
- 多组条形图:包含多个类别的对比数据,如“2025年与2025年中美三国GDP对比”,需突出组间差异及变化趋势。
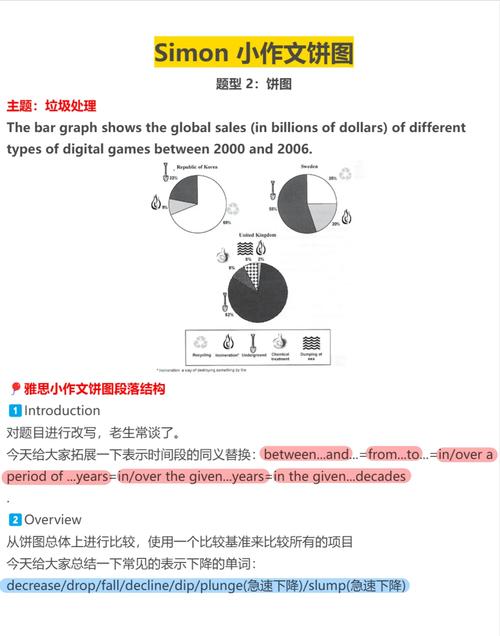
- 堆叠条形图:将不同子类数据叠加在同一个条形中,如“某公司各季度销售额构成(产品A/B/C占比)”,需分析总量及子类占比关系。
- 分段条形图:与堆叠图类似,但子类数据并列显示,便于直观比较各子类在不同主类下的数值。
无论哪种类型,核心任务均为“数据化描述”和“逻辑化分析”,避免简单罗列数据,需提炼核心趋势(如最高/最低值、变化幅度、交叉对比等)。
条形图写作结构与步骤
雅思小作文建议篇幅为150-200词,结构需清晰紧凑,通常分为引言段、主体段和总结段三部分,具体步骤如下:
(一)引言段:改写题目,明确图表内容
引言段需用1-2句话概括图表核心信息,包括:图表类型、时间范围(若有)、核心主题及主要类别,避免直接复制题目原句,可通过替换同义词、调整语序实现改写。
示例(题目:The chart below shows the percentage of renewable energy in the total energy supply of four countries in 2025.):
The bar chart illustrates the proportion of renewable energy in the overall energy supply across four nations—Canada, Germany, Japan, and Australia—in the year 2025.
(二)主体段:分组描述,突出对比与趋势
主体段是得分关键,需根据数据逻辑合理分段,避免按类别逐条描述(如“A国…B国…C国…”),而应采用“同类合并”“对比分析”的逻辑,提炼核心特征,建议每段聚焦1-2个核心趋势,结合具体数据支撑。
数据分组策略
- 按数值大小分组:将数据分为“最高/较高/中等/较低/最低”等层次,描述排序关系。
例:Among the four countries, Canada had the highest renewable energy share, accounting for 40%, while Australia ranked second with 35%. Germany and Japan lagged behind, at 25% and 15% respectively. - 按变化趋势分组(若含多组数据):将增长/稳定/下降的类别合并,突出动态变化。
例:From 2025 to 2025, the renewable energy proportion in Canada and Australia showed an upward trend, increasing by 10% and 8% respectively. In contrast, Germany and Japan experienced slight declines of 3% and 5%. - 按子类占比分组(堆叠/分段图):先描述总量,再分析子类构成。
例:The total energy supply of the four countries was dominated by fossil fuels, which accounted for over 60%. Notably, Canada’s renewable energy was primarily sourced from hydropower (25%), whereas Japan relied more on solar energy (8%).
数据描述技巧
- 精准引用数据:避免模糊表述(如“a lot of”),需结合具体数值(百分比、数值、倍数等),并注意单位一致。
错误示例:Germany’s renewable energy was very low.
正确示例:Germany’s renewable energy accounted for only 25%, significantly lower than Canada’s 40%. - 突出极值与对比:明确最高值、最低值、倍数关系、差异点等关键信息。
例:The gap between Canada (40%) and Japan (15%) was as large as 25 percentage points, indicating a significant disparity in renewable energy adoption. - 合理使用“占”的表达:避免重复使用“accounted for”,可替换为“comprised”“made up”“constituted”“represented”等。
(三)总结段:概括核心趋势,无需新数据
总结段需用1句话概括图表最突出的整体特征,避免重复具体数据,而是提炼宏观结论(如“整体差异显著”“某类占主导”“呈增长趋势”等)。
示例:Overall, renewable energy adoption varied considerably among the four countries, with Canada and Australia leading the transition towards cleaner energy sources.
条形图常用表达与句式
(一)数据描述类
- 表示“占比”:A accounted for X% of B. / A made up X% of the total. / A constituted X% of B.
- 表示“排名”:A ranked first/second... with X%. / A was the highest/lowest, at X%.
- 表示“对比”:A was significantly higher/lower than B (X% vs. Y%). / The gap between A and B was X percentage points.
- 表示“变化”(若含动态数据):A increased/decreased by X% from... to... / There was a rise/fall of X% in A.
(二)逻辑连接类
- 转折:however, in contrast, while, whereas
- 递进:moreover, in addition, furthermore
- 举例:for example, for instance, such as
- overall, in general, to sum up
范文解析(以多组条形图为例)The bar chart shows the number of male and female students enrolled in higher education in three countries (UK, USA, Australia) in 2010 and 2025.
范文:
The bar chart compares the number of male and female students in higher education across the UK, the USA, and Australia for the years 2010 and 2025. Overall, all three countries witnessed a growth in total higher education enrollments, with females consistently outnumbering males in each case.
In 2010, the USA had the highest total number of students, with 2 million males and 2.2 million females, making it the leading country in terms of higher education participation. The UK followed with 1.5 million males and 1.7 million females, while Australia recorded the smallest figures, at 0.8 million and 1 million respectively. Notably, in all three nations, female enrollments exceeded male enrollments, with the gender gap being most pronounced in the USA (200,000 more females).
By 2025, enrollments had increased across the board. The USA remained the largest contributor, with male students rising to 2.3 million and females to 2.6 million. The UK saw a similar upward trend, with totals reaching 1.8 million for males and 2 million for females. Australia experienced the most significant proportional growth, with male students increasing by 50% to 1.2 million and females by 40% to 1.4 million. Despite these changes, the pattern of female dominance persisted, and the gender gap in the USA widened to 300,000.
In summary, higher education enrollments grew in all three countries between 2010 and 2025, with females consistently outpacing males, particularly in the USA.
常见错误与注意事项
- 忽略数据单位:图表中数据可能为“百万”“百分比”等,写作时需明确标注,避免歧义。
- 过度描述细节:聚焦核心趋势(如最高/最低值、显著变化),无需提及所有数据点。
- 缺乏逻辑连接:段落间需使用连接词,确保行文连贯,而非简单堆砌句子。
- 主观臆断:仅基于图表数据描述,不添加个人观点或未提及的原因(如“政府政策推动”等)。
FAQs
Q1: 条形图中数据较多时,如何避免描述过于冗长?
A1: 优先提炼“核心数据”和“对比关系”,而非逐条罗列,将数据按“高-中-低”分组,描述每组的代表值及差异;若含多组时间数据,突出“增长最快/最慢”或“变化显著”的类别,忽略微小波动,可使用“the majority of”“a significant proportion of”等概括性表达简化次要数据。
Q2: 堆叠条形图和分段条形图在写作时有什么区别?
A2: 堆叠条形图需先描述“总量”,再分析“子类占比关系”,强调各子类对总量的贡献(如“ fossil fuels accounted for 60%, with coal making up 30% of this total”);分段条形图则侧重“同类子组在不同主类下的对比”,需横向比较各主类中子类的数值差异(如“in 2025, coal consumption was highest in the USA (40%) and lowest in Australia (20%)”),前者关注“构成”,后者关注“对比”。