雅思小作文的写作模板是帮助考生快速构建文章结构、规范表达逻辑的重要工具,尤其对于时间紧张的考试场景而言,合理的模板运用能有效提升写作效率和得分稳定性,但需注意,模板并非机械套用的“万能公式”,而是需结合题目类型和具体数据灵活调整的“框架指引”,以下从不同题型出发,结合核心结构和表达技巧,详细拆解雅思小作文的模板应用方法,并辅以实例说明,最后附相关FAQs。
雅思小作文核心结构与通用模板框架
无论何种题型,雅思小作文(学术类)均需包含四个核心部分:引言(Introduction)、主体段(Body Paragraphs)、Conclusion),其中主体段根据题型可分为1-3段,重点描述数据特征、趋势或对比关系,通用框架如下:
引言段:改写题目,明确图表类型与核心内容
功能:开篇点题,说明图表类型(如线图、柱状图、饼图、表格、流程图、地图题),概括图表反映的核心主题(如“某国2000-2025年间可再生能源占比变化”),无需提及具体数据。
模板句:
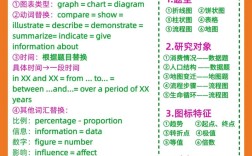
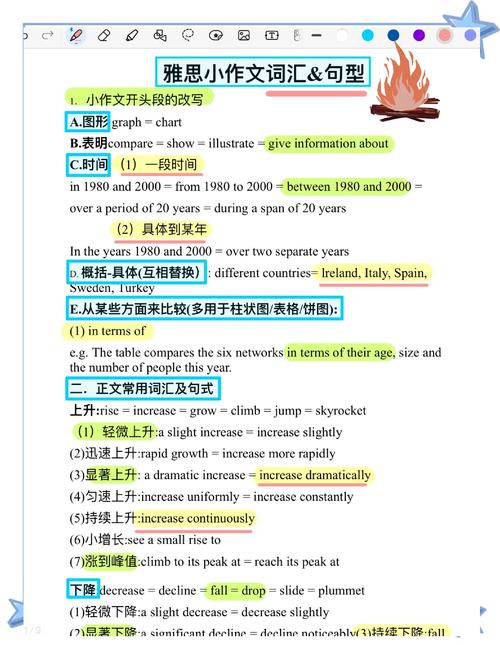
- The chart/graph/table illustrates the changes in [主题] over [时间段] / compares [对象] in terms of [指标].
- The provided [图表类型] presents data regarding [主题], specifically focusing on [核心内容,如“不同年龄组的运动频率”“产品生产流程的步骤”].
- As is depicted/illustrated in the [图表类型], the information reflects [主题] during [时间段] / across [不同类别].
示例(线图题): The line graph below shows the number of visitors to a museum in a city from 2010 to 2025.
引言段*:The line graph illustrates the changes in the number of visitors to a city museum over the six-year period from 2010 to 2025.
主体段:数据描述与逻辑分层(按题型展开)
主体段是得分关键,需根据题型选择核心逻辑,突出“主要特征+具体数据支撑”,避免堆砌无关数据。

分题型模板与技巧详解
(一)数据类图表(线图、柱状图、饼图、表格):描述趋势、对比与占比
核心逻辑:先整体趋势/最大值最小值,再分类对比/细节数据,按“时间顺序”“类别分组”“数据大小排序”分层。
线图(Line Graph):动态数据,侧重趋势变化
结构:1-2段(若多条线,按“整体趋势+分类对比”或“每条线单独描述+对比”)。
核心表达:
- 趋势词:上升(increase/rise/grow/soar)、下降(decrease/drop/decline/plummet)、波动(fluctuate)、平稳(remain stable/steady)、峰值(peak/reach a high point)、谷值(hit a low point)。
- 程度副词:slightly(轻微)、significantly(显著)、dramatically(急剧)、gradually(逐渐)。
模板句:
- 整体趋势:Overall, the number of [主题] [趋势描述] during [时间段], with a [程度] increase/decrease from [起始数据] to [结束数据].
- 分类描述:In terms of [类别A], it witnessed a [趋势] from [数据1] in [年份1] to [数据2] in [年份2], while [类别B] experienced an opposite trend, [具体描述].
- 细节数据:Specifically, [类别A] peaked at [数据] in [年份], whereas [类别B] dropped to its lowest point of [数据] in [年份].
示例(双线图:博物馆游客数与本地游客占比):
主体段1(整体趋势):Overall, the total number of visitors to the museum increased significantly from 50,000 in 2010 to 120,000 in 2025, while the proportion of local visitors fluctuated slightly, ranging from 40% to 55%.
主体段2(分类对比):Regarding local visitors, their number rose steadily from 20,000 (40% of total) in 2010 to 66,000 (55% of total) in 2025. In contrast, non-local visitors showed a more dramatic growth, climbing from 30,000 (60%) in 2010 to 54,000 (45%) in 2025, despite a slight dip between 2012 and 2025.

柱状图(Bar Chart):静态/动态数据,侧重对比与差异
结构:1-2段(按“时间顺序”或“类别对比”,若数据多,选取TOP3及最小值)。
核心表达:
- 对比词:higher/lower than, similar to, the same as, rank first/last among.
- 句型:[类别A] was [数据], [比较词] [类别B] ([数据]). / The figure for [类别A] accounted for [占比], which was [比较词] that of [类别B].
模板句:
- 类别对比:In terms of [类别A], it recorded the highest number of [指标] at [数据], significantly higher than [类别B] ([数据]) and [类别C] ([数据]).
- 时间对比:Between [年份1] and [年份2], [类别A] experienced a [程度] increase from [数据1] to [数据2], whereas [类别B] remained relatively stable with a slight fluctuation around [数据].
示例(柱状图:2025-2025年三国手机品牌市场份额):
主体段:In 2025, Samsung dominated the smartphone market in Country A with a 35% share, followed by Apple (25%) and Huawei (20%). However, by 2025, Huawei's share had surged to 30%, surpassing Apple (22%) and narrowing the gap with Samsung (33%). Meanwhile, Country B showed a different pattern: Apple held the largest share (40%) in both years, while Samsung's share declined from 30% to 25%, and Huawei remained relatively stable at around 15%.
饼图(Pie Chart):静态数据,侧重占比与组成
结构:1段(按“占比从高到低”,或“最大/最小占比+其他类别”)。
核心表达:
- 占比词:account for (占比), constitute (构成), make up (占据), occupy (占比)。
- 对比词:the largest proportion/minority, twice as much as, a significant majority of.
模板句:
- 整体占比:The pie chart illustrates the proportion of [主题] in [某年], with [最大类别] accounting for the largest share at [数据], followed by [次大类] ([数据]) and [其他类别] ([数据]).
- 细节对比:Notably, [类别A] constituted [占比], which was significantly higher than [类别B] ([占比]). Meanwhile, [类别C] and [类别D] both accounted for relatively small proportions, at [数据] and [data] respectively.
示例(饼图:2025年全球可再生能源类型占比):
主体段:The pie chart presents the global share of renewable energy sources in 2025, with solar energy constituting the largest proportion at 35%, followed by wind energy (28%) and hydropower (22%). Biomass and geothermal energy accounted for smaller shares, at 10% and 5% respectively. Notably, solar and wind energy together made up nearly two-thirds of the total renewable energy mix, highlighting their dominance in the sector.
表格(Table):多维度数据,侧重对比与差异
结构:1-2段(按“行/列对比”,或“最大值/最小值+显著差异”)。
核心表达:
- 对比句:The data reveals that [类别A] had the highest [指标] ([数据]), while [类别B] recorded the lowest ([数据]). / In terms of [指标], [类别A] outperformed [类别B] by [数据].
模板句:
- 行列对比:According to the table, [行类别A] showed the highest value in [列指标] at [数据], whereas [行类别B] had the lowest figure, with only [数据].
- 趋势对比:Between [时间1] and [时间2], [行类别A] experienced a [程度] increase in [列指标] from [数据1] to [data2], in contrast to [行类别B], which saw a slight decline from [data3] to [data4].
示例(表格:2025-2025年三国教育支出占GDP比例):
主体段:The table compares the proportion of GDP spent on education in three countries from 2025 to 2025. Finland consistently allocated the highest percentage, with 7.2% in 2025, 7.5% in 2025, and 7.8% in 2025. In contrast, Brazil spent the least, at 5.8%, 6.0%, and 6.1% respectively, showing a gradual but modest increase. Canada's expenditure remained relatively stable, fluctuating between 6.2% and 6.5% over the three years.
(二)流程图与地图题:描述步骤与变化
核心逻辑:按“时间/空间顺序”分步描述,使用连接词体现逻辑,无需数据对比。
流程图(Process):步骤清晰,侧重流程衔接
结构:1-2段(按“步骤分组”,如“准备阶段→核心阶段→完成阶段”)。
核心表达:
- 连接词:Firstly/First of all, Secondly, Then, Next, Subsequently, Finally, After that, At this stage.
- 动词:begin with, start by, follow this step, undergo..., be transformed into, result in.
模板句:
- 开头:The flowchart illustrates the process of [主题], which involves [步骤数量] main stages.
- 步骤描述:Initially, [原材料/初始状态] is [第一步动作, e.g., collected/washed], and then it is [第二步动作, e.g., heated to a certain temperature]. Subsequently, [中间产物] undergoes [第三步动作, e.g., a chemical reaction] to form [最终产物]. Finally, the final product is [最后一步动作, e.g., packaged and distributed].
示例(流程图:巧克力制作过程):
主体段:The chocolate production process begins with the harvesting of cocoa pods from cocoa trees. The harvested pods are then split open to extract the cocoa beans, which are left to ferment for several days. Following fermentation, the beans are dried under the sun to reduce moisture content. Next, the dried beans are roasted at a high temperature to enhance flavor, after which they are crushed to separate the cocoa solids from the cocoa butter. Finally, the cocoa solids and butter are mixed with sugar and other ingredients to form chocolate, which is then molded into bars and packaged for sale.
地图题(Map):空间变化,侧重对比与方位
结构:1-2段(“过去vs现在”对比,或“方位布局描述”)。
核心表达:
- 方位词:north/south/east/west of, next to, adjacent to, opposite, in the corner of, in the center of.
- 变化词:has been transformed into, has been replaced by, was removed, was added, expanded into.
模板句:
- 地点布局:The map shows the layout of [地点] in [年份], with [主要建筑/设施] located in the center, surrounded by [周边设施].
- 变化对比:Compared with [过去时间], [地点] has undergone significant changes. For instance, [原A] has been replaced by [新B], and a new [设施C] has been constructed to the north of [参照物]. Additionally, [原D] was removed to make way for [新E].
示例(地图题:某公园2010年与2025年变化):
主体段:The two maps illustrate the changes in a city park between 2010 and 2025. In 2010, the park featured a large lake in the center, with a playground on the west side and a small café on the east. By 2025, the lake had been expanded to cover a larger area, and the original playground was replaced by a new tennis court and a swimming pool. Moreover, a flower garden was added to the south of the lake, adjacent to the entrance, while the café was relocated to the north side, near the parking lot.
(三)结论段:总结核心特征,无需新数据
功能:重申图表核心趋势/对比,呼应引言,避免重复细节。
模板句:
- In summary, the key trend reflected in the chart is [核心趋势,如“可再生能源占比持续上升”].
- Overall, it is clear that [核心对比,如“Country A的支出始终高于Country B”], with [最显著数据] being the most notable feature.
- To conclude, the data suggests that [如“流程效率主要取决于第二步的处理时间”].
模板使用注意事项
- 拒绝机械套用:模板是“骨架”,需根据题目具体数据填充“血肉”,例如线图若出现“先升后降再平稳”,需用模板中的趋势词组合描述,而非固定用“一直上升”。
- 数据筛选有逻辑:选取“最大值、最小值、显著变化、平均值”等关键数据,避免罗列所有数据(饼图除外,需描述所有类别占比)。
- 语法与词汇准确:模板中的“increase/decrease”需搭配“by+具体数值”或“to+最终数值”(如“increase by 20%”或“increase to 120”);避免使用“a lot of”等口语化表达,替换为“a significant number of”。
相关FAQs
Q1:雅思小作文模板必须完全套用吗?会不会因为模板雷同被扣分?
A:模板并非“必须套用”的固定框架,而是帮助考生快速搭建结构的“思路指引”,考官关注的是“内容相关性、数据描述准确性、逻辑连贯性”,而非模板本身,若完全机械套用(如所有线图都用“Overall, the number increased”),忽略题目具体数据特征,反而会因内容空洞、缺乏针对性被扣分,建议以模板为“基础框架”,结合题目数据灵活调整表达,例如针对“波动大”的线图,重点描述“fluctuate”的具体节点;针对“对比强烈”的柱状图,突出“outperform/double”等差异词,从而体现个性化分析,避免模板化痕迹。
Q2:流程图和地图题没有数据,如何用模板展开描述?
A:流程图和地图题虽无具体数据,但可通过“步骤顺序”“空间逻辑”和“动作/变化描述”填充内容,流程图按“时间顺序”用“Firstly→Secondly→Then→Finally”连接,每个步骤用“主动语态”(如“The beans are fermented”)或“被动语态”(如“Cocoa pods are harvested”)描述动作;地图题按“方位词”(north/south/adjacent to)和“变化词”(be replaced by/be added to)对比不同时期的布局差异,原停车场旁新增了一座图书馆,而东侧的老旧建筑被拆除改建为花园”,核心是“逻辑清晰、步骤/变化完整”,无需纠结数据缺失,只需准确呈现图表中的流程或空间信息即可。