雅思曲线类作文是雅思写作Task 1中常见的数据描述题型,主要考察考生对动态数据(随时间变化的数据)的观察、分析和表达能力,这类题目通常提供一条或多条曲线图表,要求考生在20分钟内完成至少150字的描述,内容需涵盖数据总体趋势、关键特征(如峰值、谷值、转折点)以及不同数据间的对比,以下从结构要点、核心技巧和实例解析三个方面,详细解析如何写好雅思曲线类作文。

曲线类作文的结构要点
清晰的结构是高分作文的基础,建议采用“总-分-总”的三段式布局,确保逻辑连贯、重点突出。
开头段:概述图表信息
开头段需简洁明了,包含以下核心要素:
- 图表类型:明确指出是“line graph”(曲线图);
- 核心主题:概括图表反映的主要内容(如“某国2000-2025年能源消耗变化”);
- 时间范围:说明数据覆盖的时间段;
- 总体趋势:用1-2句话总结最显著的趋势(如“总体呈上升趋势”“可再生能源占比显著增加”)。
示例:
The line graph illustrates the changes in the proportion of three types of energy sources (coal, oil, and renewable energy) consumed in a country from 2000 to 2025. Overall, while coal and oil showed fluctuating trends with a general decline, renewable energy experienced a steady increase, becoming the dominant source by 2025.
主体段:分点描述关键特征
主体段是得分关键,需分段落详细描述数据,避免堆砌数字,而是突出“趋势+具体数据+对比”,建议按以下逻辑展开:
- 分段依据:若有多条曲线,可按“单一曲线趋势”或“时间阶段”分段(如“2000-2010年”和“2010-2025年”);
- 描述顺序:从总体到局部,先写主要趋势,再写峰值、谷值、转折点等细节;
- 数据对比:若涉及多个数据(如不同能源类型),需横向对比差异,如“coal consumption decreased from 60% in 2000 to 40% in 2025, while renewable energy rose from 10% to 35% over the same period”。
结构建议:
- 每段聚焦1-2个核心趋势(如“可再生能源的增长趋势”);
- 使用“连接词”串联逻辑(如However, In contrast, Similarly);
- 数据呈现“具体数值+趋势描述”(如The figure for coal peaked at 60% in 2005, before dropping to 40% in 2025)。
结尾段:总结核心趋势
结尾段无需重复细节,需用1-2句话概括图表最核心的结论,呼应开头段的“总体趋势”,可补充数据间的最终对比(如“By 2025, renewable energy had surpassed coal and oil to become the most widely used energy source”)。
高分技巧与注意事项
动态数据描述的核心词汇
准确使用动态描述词汇是基础,需区分“上升/下降”的程度和趋势:
- 上升:increase, rise, grow, surge, soar, climb(surge/s soar表示“急剧上升”);
- 下降:decrease, decline, drop, fall, plummet(plummet表示“暴跌”);
- 波动:fluctuate, vary, oscillate(fluctuate between...and...表示“在...间波动”);
- 平稳:stabilize, remain constant/unchanged, level off(level off at...表示“稳定在...”)。
示例:
Renewable energy consumption surged from 10% in 2000 to 35% in 2025, while coal plummeted from 60% to 40% during the same period.
数据选取与呈现技巧
- 避免所有数据罗列:选取“峰值、谷值、转折点、起始/结束值”等关键数据,通常每条曲线描述3-5个核心数据点;
- “约数”表达更自然:可用approximately, around, roughly代替精确数字(如around 60%);
- 对比数据突出差异:通过while, whereas, compared with等连接词强化对比,如Oil consumption remained relatively stable, whereas coal experienced a significant decline.
常见错误规避
- 时态错误:描述过去数据需用一般过去时(increased, dropped),若预测未来则用一般将来时(is projected to rise);
- 无逻辑堆砌数据:需先写趋势,再举例数据,而非单纯报数;
- 忽略单位/时间范围:开头需明确时间范围,数据描述中若涉及单位(如%, million)需标注。
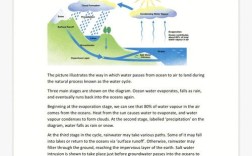
实例解析(以“某国2000-2025年交通方式使用比例”为例)
图表信息
曲线图展示了2000-2025年某国四种交通方式(汽车、公交、自行车、地铁)的使用比例变化。
开头段
The line graph presents the proportion of four modes of transport (car, bus, bicycle, and subway) used in a country from 2000 to 2025. Overall, car usage remained the highest but showed a slight decline, while the subway experienced the most significant growth, surpassing bus and bicycle usage by 2025.
主体段1(汽车与公交)
In terms of car and bus usage, cars were the dominant mode throughout the period, accounting for approximately 50% in 2000. However, this figure fluctuated slightly, dropping to 45% by 2025. In contrast, bus usage declined more markedly, from 30% in 2000 to 20% in 2025, with a stable trend after 2010.
主体段2(自行车与地铁)
Bicycle and subway usage showed contrasting patterns. Bicycle proportion remained relatively low, starting at 15% in 2000 and decreasing gradually to 10% by 2025. The subway, by contrast, witnessed a dramatic increase: it began at only 5% in 2000, surged to 25% in 2025, and reached 25% again in 2025, becoming the second most popular mode after cars.
结尾段
In summary, cars remained the primary transport choice, but their share decreased slightly. The subway emerged as a key alternative, replacing buses as the second most used mode, while bicycle usage continued to decline.
相关问答FAQs
Q1: 曲线类作文中,如果有多条曲线,应该如何分配段落?
A1: 若曲线数量≥3条,建议按“数据关联性”或“趋势相似性”分段,将趋势相似的曲线(如两条均上升)合并为一段,差异大的单独成段,避免每段只写一条曲线,否则结构会显得松散,描述“能源消耗”时,可将“coal和oil”(均下降)合并为一段,“renewable energy”(上升)单独成段,突出对比。
Q2: 如何处理曲线中的“波动”数据?是否需要描述每一个波动点?
A2: 波动数据需描述“波动范围+总体趋势”,无需逐点列举。“The proportion fluctuated between 20% and 30% from 2000 to 2010, before stabilizing at 25%”即可,若波动幅度大(如先升后降再升),需标注关键转折点(如peaked at 35% in 2005, then dropped to 20% in 2010),但避免过度细节导致逻辑混乱。