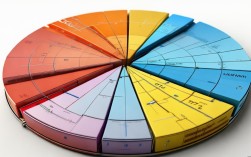
在英语写作中,图表描述类作文是常见题型,尤其是饼状图(Pie Chart)的分析,无论是雅思、托福还是四六级考试,这类题目都要求考生准确描述数据并展开分析,掌握一套清晰的写作模板,不仅能提高文章的逻辑性,还能让表达更加流畅,以下是一套高效的饼状图英语作文模板,帮助你在考试或日常写作中轻松应对。

饼状图作文的基本结构
一篇完整的饼状图英语作文通常包括四个部分:引言(Introduction)、概述(Overview)、细节描述(Detailed Description)和结论(Conclusion),每个部分都有其固定表达方式,合理运用可以让文章层次分明。
(1)引言(Introduction)
引言部分需简要介绍图表主题,通常1-2句话即可,可以使用以下句型:
- The pie chart illustrates/shows/depicts the distribution/proportion of...
- The given pie chart provides information about...
- This pie chart presents data on...
示例:
The pie chart illustrates the percentage of energy consumption from different sources in a country in 2023.
(2)概述(Overview) 部分需总结图表的主要趋势或最显著的特征,无需涉及具体数据,常用表达:
- Overall, the largest proportion/smallest segment is...
- The most noticeable feature is...
- It is clear that... dominates the chart.
示例:
Overall, fossil fuels account for the largest share of energy consumption, while renewable sources make up a relatively small portion.
(3)细节描述(Detailed Description)
这部分需具体分析数据,通常按从大到小或从主到次的顺序描述,可以使用比较级、最高级或具体百分比:

- ...constitutes/accounts for X%, followed by... at Y%.
- The proportion of... is significantly higher/lower than...
- A mere X% is attributed to...
示例:
Coal constitutes 40% of total energy use, followed by natural gas at 30%. Renewable energy, including solar and wind, accounts for only 15%, while nuclear power makes up the remaining 15%.
(4)Conclusion)
结论部分可简要总结或提出推论,但并非必需,如果题目要求分析原因或影响,可适当扩展:
- In conclusion, the data suggests that...
- This trend may indicate...
- Possible reasons for this distribution include...
示例:
The heavy reliance on fossil fuels highlights the need for increased investment in renewable energy to ensure sustainable development.
高分表达技巧
(1)避免重复词汇
描述数据时,不要反复使用“account for”或“make up”,可替换为:
- represent
- comprise
- contribute to
- occupy
(2)使用比较句型
适当运用比较级和最高级,使分析更生动:

- ...is twice as high as...
- ...is slightly lower than...
- ...ranks the highest among all categories.
(3)合理使用连接词
确保段落间逻辑流畅,可使用:
- In contrast,...
- Similarly,...
- Furthermore,...
- On the other hand,...
常见错误及避免方法
(1)数据描述不准确
确保百分比和趋势描述正确,避免混淆“increase”和“decrease”。
(2)忽略单位或时间
如果图表涉及年份或单位(如%或tons),需在文中提及。
(3)过度主观推测 要求,否则避免加入个人观点,保持客观描述。
实战练习
*
The pie chart below shows the percentage of different types of waste recycled in a city in 2022. Summarize the information and make comparisons where relevant.*
参考范文:
The pie chart illustrates the proportions of various waste materials recycled in a city in 2022. Overall, paper and cardboard were the most commonly recycled materials, while glass accounted for the smallest share.

Paper and cardboard constituted 45% of the total recycled waste, making them the largest category. Plastic followed at 25%, while metal recycling represented 20%. In contrast, glass recycling was significantly lower, at only 10%.
This data suggests that paper and plastic recycling efforts are more advanced compared to glass, possibly due to higher demand for recycled paper and plastic products.
个人观点
掌握饼状图英语作文模板的关键在于多练习和灵活运用,通过熟悉固定句型、丰富词汇和避免常见错误,写作水平会显著提升,建议平时多分析各类图表,积累相关表达,考试时才能游刃有余。